

"欧盟统计年鉴"相关数据
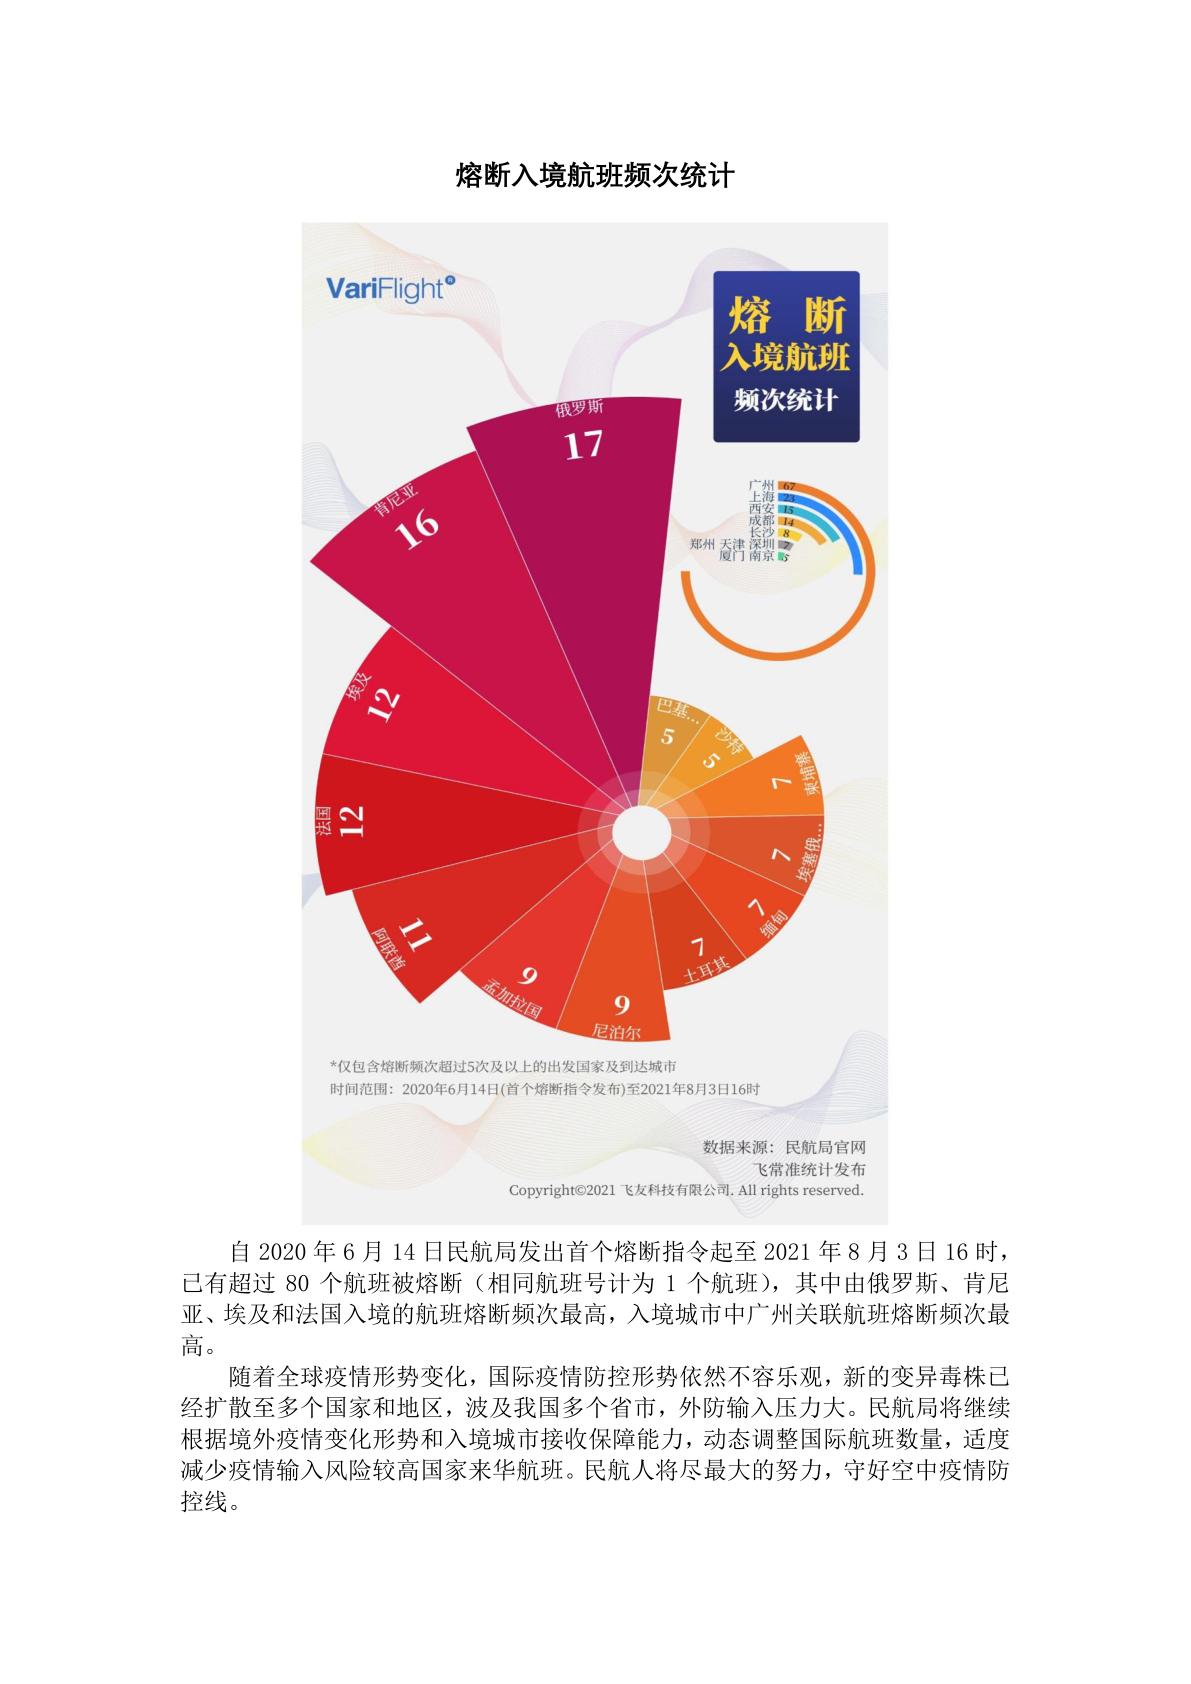
更新时间:2021-11-10自2020年6月14日民航局发出首个熔断指令起至2021年8月3日16时,已有超过80个航班被熔断(相同航班号计为Ⅰ个航班),其中由俄罗斯、肯尼亚、埃及和法国入境的航班熔断频次最高,入境城市中广州关联航班熔断频次最高。
 2005-2019年K12领域公司的地域分布情况统计该统计数据包含了2005-2019年K12领域公司的地域分布情况统计。自1990-2019年间,北京的K12领域公司最多,达131家。2005-2019年发布时间:2019-06-12
 1967-2019年垂直电商领域创企的地域分布情况统计该统计数据包含了1967-2019年垂直电商领域创企的地域分布情况统计。2019年北京垂直电商领域创企公司数量为1212家。1967-2019年发布时间:2019-06-25
 2013-2018年中国春节档电影总票房的统计情况该统计数据包含了2013-2018年春节档电影总票房的统计情况。2018年春节档电影总票房为57.1亿元。2013-2018年发布时间:2019-08-26
 2005-2019年K12领域公司融资事件按地域分布情况统计该统计数据包含了2005-2019年K12领域公司融资事件按地域分布情况统计。2019年北京K12领域公司融资事件有262起。2005-2019年发布时间:2019-06-12
 1994-2019年芯片领域创新企业公司融资事件按地域分布情况统计该统计数据包含了1994-2019年芯片领域创新企业公司融资事件按地域分布情况统计。自1994-2019年间,上海地区芯片领域创新企业公司融资事件最多,达134起。1994-2019年发布时间:2019-05-29
 2019年中国电影市场年度票房统计Top10该统计数据包含了2019年中国电影市场年度票房统计Top10。2019年中国电影市场年度票房排名第一的哪吒之魔童降世总票房为497488万。2019年发布时间:2019-12-24
 1953-2019年中国新能源汽车领域公司的成立情况统计该统计数据包含了1953-2019年新能源汽车领域公司的成立情况统计。2019年新能源汽车领域共成立了4家公司。1953-2019年发布时间:2019-05-24
 2003-2019年中国电子烟领域创业公司的成立情况统计该统计数据包含了2003-2019年电子烟领域创业公司的成立情况统计。2019年电子烟领域创业公司共成立3家。2003-2019年发布时间:2019-05-16
 1999-2018年中国深度学习领域创企的地域分布情况统计该统计数据包含了1999-2018年深度学习领域创企的地域分布情况统计。2018年北京深度学习领域创企公司数量为141家。1999-2018年发布时间:2019-06-25
 2005-2019年中国智能机器人企业的地域分布情况统计该统计数据包含了2005-2019年智能机器人企业的地域分布情况统计。截止到2019年,北京地区的智能机器人企业达87家。2005-2019年发布时间:2019-06-10
 2000-2019年垂直电商领域创企的融资轮次按时间分布情况统计该统计数据包含了2000-2019年垂直电商领域创企的融资轮次按时间分布情况统计。2019年垂直电商领域创企的种子轮融资轮次为2起。2000-2019年发布时间:2019-06-25
 1953-2019年中国新能源汽车领域公司的地域分布情况统计该统计数据包含了1953-2019年新能源汽车领域公司的地域分布情况统计。自1953-2019年间,北京地区新能源汽车领域公司分布最多,达1210家。1953-2019年发布时间:2019-05-24
 2017年中国国产动画电影TOP10票房及口碑指数统计该统计数据包含了2017年我国国产动画电影TOP10票房及口碑指数统计。2017年国产动画电影《熊出没之奇幻空间》的票房是5.2亿元,豆瓣评分6.4分。2017年发布时间:2020-08-24
 1999-2018年中国深度学习领域创企的成立时间情况统计该统计数据包含了1999-2018年深度学习领域创企的成立时间情况统计。2018年深度学习领域共成立公司16家。1999-2018年发布时间:2019-06-25
 1967-2019年中国垂直电商领域创企的成立时间情况统计该统计数据包含了1967-2019年垂直电商领域创企的成立时间情况统计。2019年垂直电商领域创企共计7家。1967-2019年发布时间:2019-06-25
 2005-2019年中国智能机器人企业融资事件按地域分布情况统计该统计数据包含了2005-2019年智能机器人企业融资事件按地域分布情况统计。2019年北京智能机器人企业融资事件为216起。2005-2019年发布时间:2019-06-10
 2018年H1中国国产动画电影TOP10票房及口碑指数统计该统计数据包含了2018年H1我国国产动画电影TOP10票房及口碑指数统计。2018年上半年国产动画电影《熊出没·变形记》的票房为6.1亿元,豆瓣评分为6.8分。2018年发布时间:2020-08-24
 2000-2019年中国深度学习领域创企的融资轮次按时间分布情况统计该统计数据包含了2000-2019年深度学习领域创企的融资轮次按时间分布情况统计。2019年深度学习领域创企天使轮的融资轮次有2起。2000-2019年发布时间:2019-06-25
 2005-2019年中国K12领域公司融资事件按地域和时间分布情况统计该统计数据包含了2005-2019年K12领域公司融资事件按地域和时间分布情况统计。2019年北京K12领域公司融资事件有14起。2005-2019年发布时间:2019-06-12
 2015-2017年中国电影市场重点档期内新上映动画电影数量统计该统计数据包含了2015-2017年我国电影市场重点档期内新上映动画电影数量统计。2017年我国贺岁档新上映的动画电影数量为5部。2015-2017年发布时间:2020-08-24

