

"欧盟统计年鉴"相关数据
更新时间:2024-04-232019世界能源统计年鉴
In particular,the data compiled in this year's Review suggest that in 2018,global energy demand and carbon emissions from energy use grew at their fastest rate since 2010/11,moving even fur ther away from the accelerated transition envisaged by the Paris climate goals.
BP's economics team estimate that much of the rise in energy growth last year can be traced back to weather-related effects,as farmilies and businesses increased their demand for cooling and heating in response to an unusually large number of hot and cold days.The acceleration in carbon emissions was the direct result of this increased energy consumption.
Even if these weather effects are short-lived,such that the growth in energy demand and carbon emissions slow over the next few years,there seems lttle doubt that the current pace of progress is inconsistent with the Paris climate goals.The world is on an unsustainable path:the longer carbon emissions continue to rise,the harder and more costly will be the eventual adjustment to net-zero carbon emissions.Yet another year of growing carbon emissions underscores the urgency for the world to change.
The Statistical Review provides a timely and objective insight into those developments and how that change can begin to be achieved.
The strength iท energy consumption was reflected acroรs all the fuels,many of which grew more strongly than their recent historical averages.This acceleration was particularly pronounced for natural gas,which grew at one of its fastest rates for over 30 years,accounting for over 40% of the growth in primary energy.On the supply side,the data for 2018 reinforced the central importance of the US shale revolution.
【更多详情,请下载:2019世界能源统计年鉴】
- 2019世界能源统计年鉴年鉴对全球能源数据进行了全面的汇总与分析。本年度年鉴强调,针对气候变化采取行动的呼声日益高涨,但减少碳排放的实际进展却相对缓慢,目标与现实之间的差距日益显著。2019年发布时间:2019-08-14
 2021版bp世界能源统计年鉴2021年发布时间:2022-02-16
 2023世界能源统计年鉴2023年发布时间:2024-02-05
 2022年世界能源统计年鉴2022年发布时间:2023-10-20
 1995-2021Q3各季度欧盟GDP该统计数据包含了1995-2021Q3各季度欧盟GDP。2021年三季度欧盟GDP3.648万亿欧元。1995-2021年发布时间:2021-12-16
 2015年-2021年各季度欧盟GDP同比增速该统计数据包含了2015年-2021年各季度欧盟GDP同比增速。2021年三季度欧盟GDP同比增长4.1%。2015-2021年发布时间:2022-02-17
 欧盟酒店住宿分布市场研究2023年发布时间:2023-06-16
 2015年一季度-2021年四季度欧盟GDP环比增速该统计数据包含了2015年一季度-2021年四季度欧盟GDP环比增速。2021年三季度欧盟GDP环比增长2.2%。2015-2021年发布时间:2022-02-17
 2011-2018年欧盟参与社交网络的个人比例该数据包含了2011-2018年欧盟参与社交网络的个人比例。2018所有个人为56%,过去3个月使用互联网的个人为65%。2011-2018年发布时间:2019-09-26
 2011-2017年欧盟个人在线参与专业网络的比例该数据包含了2011-2017年欧盟个人在线参与专业网络的比例。2017所有个人为13%,过去3个月使用互联网的个人为15%。2011-2017年发布时间:2019-09-26
 2017-2018年欧盟28个国家零售贸易营业额指数该统计数据包含了2017-2018年欧盟28个国家零售贸易营业额指数。2018年11月欧盟28个国家零售贸易营业额指数为111.9。2017-2018年发布时间:2019-09-12
 中国欧盟商会商业信心调查2023(中英)2023年发布时间:2023-09-28
 2021知识产权统计年报2021年发布时间:2022-09-14
 2017年欧盟对中国出口商品量(以十亿欧元计)该数据包含了2017年欧盟对中国出口商品量(以十亿欧元计)。机械和运输设备出口额为107.57十亿欧元。2017年发布时间:2018-11-23
 2021中国欧盟商会西南建议书2022年发布时间:2022-09-06
 技术主权视野下的欧盟数字化转型战略探析及三份文件全文翻译《欧洲数据战略》分析了全球的数据经济竞争格局及欧盟优势、劣势及核心问题,总结了欧盟为提高数据经济竞争力已经采取的立法和外交举措,并概述了欧洲未来五年为提振数据经济竞争力将采取的政策、技术和投资策略,以最大化利用数据为欧洲数字化转型提供源源不断的发展和创新动力。而统领上述两份文件的《塑造欧洲的数字未来》,则整体性地勾勒出欧盟数字化转型战略的核心要素和路线图。2020年发布时间:2020-07-21
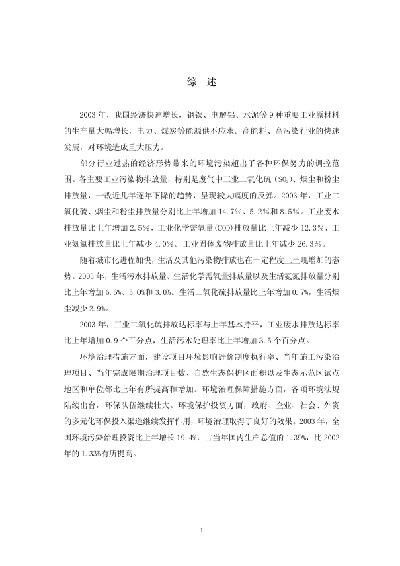 2003年环境统计年报部分行业过热的经济形势带来的环境污染超出了各种环保努力的调控范围。各主要工业污染物排放量,特别是废气中工业二氧化硫(SO2)、烟尘和粉尘排放量,一改近几年逐年下降的趋势,呈现较大幅度的反弹。2003年发布时间:2020-05-27
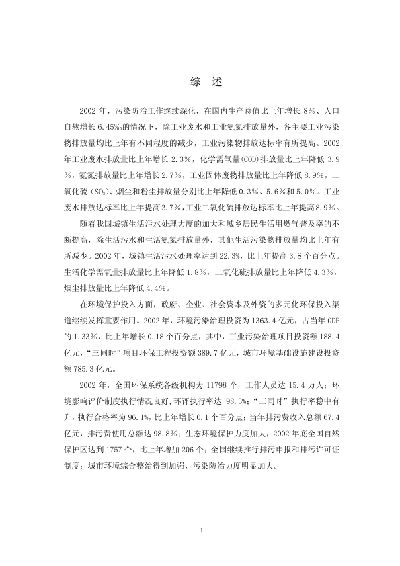 2002年环境统计年报2002 年,污染防治工作继续深化,在国内生产总值比上年增长 8%、人口自然增长 6.45‰的情况下,除工业废水和工业氨氮排放量外,各主要工业污染物排放量均比上年有不同程度的减少,工业污染物排放达标率有所提高。2002年发布时间:2020-05-27
 2013年环境统计年报与 2012 年相比,化学需氧量排放量下降 2.93%、氨氮排放量下降 3.12%、二氧化硫排放量下降 3.48%、氮氧化物排放量下降 4.72%。但是环境形势依然严峻,环境风险不断凸显,污染治理任务仍然艰巨。2013年发布时间:2020-04-30
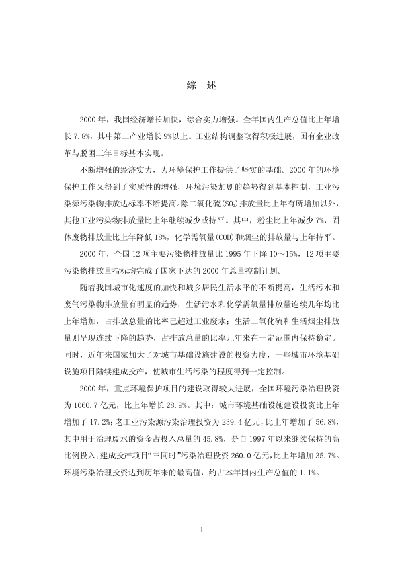 2000年环境统计年报2000年的环境保护工作又得到了实质性的增强,环境污染加剧的趋势得到基本控制,工业污染源污染物排放达标率不断提高。除二氧化硫(SO2)排放量比上年有所增加以外,其他工业污染物排放量比上年继续减少或持平。2000年发布时间:2020-04-30

