

"淘宝购物节"相关数据
更新时间:2021-12-032019年返校季购物报告
Deloitte's 2019 back-to-school survey: key findings
Back-to-school spend expected to remain relatively flat ( + 1.8% ), as online spend increases Total back-to-school spending is expected to reach $27.8B or $519 per student, up slightly from $510 in 2018 . The electronic gadgets category is expected to grow by $800M (+ 29% over 2018), while the computers and hardware category is expected to decline by $60OM (- 16% below last year);
Households plan to spend 56% of their budget in-store and 29% online with the remaining 15% up for grabs with undecided shoppers; online has grown from 22% to 29% since 2016;
Compared to last year, electronic gadgets represent the only category in which online sales are expected to grow at the expense of in-store shopping (an increase in nearly 20 percentage points);
Mobile use is expected to increase this year (+7 percentage points in planned use), while desktops/laptops, and social are expected to decline. Newer tech (e,g., voice assisted, digital reality) has yet to gain traction for B2S;
Consumers are clear: Price, product, and convenience matter most
Funda mentals matter in driving back-to-school purchases: Price is likely to be the predo minant driver with sales/discounts ( 69%) and competitive prices (57%) as the top attributes driving purchase decisions.
【更多详情,请下载:2019年返校季购物报告】

 2020年6月淘宝直播和快手的交易额情况该统计数据包含了2020年6月淘宝直播和快手的交易额情况。淘宝直播的交易额最高,交易额575.2亿元。2020年发布时间:2021-10-20
 2020年字节跳动对外投资轮次分布该统计数据包含了2020年字节跳动对外投资轮次分布。2020年字节跳动对外战略投资轮次占比为41%。2020年发布时间:2021-03-12
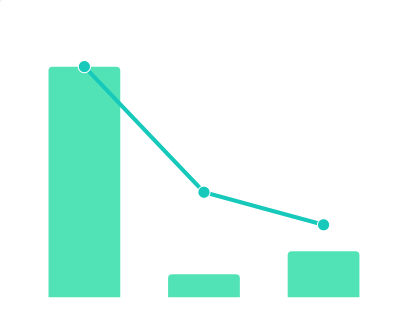 2020年字节跳动对外投资领域分布该统计数据包含了2020年字节跳动对外投资领域分布。2020年字节跳动对文娱传媒投资的事件数为10件,金额为19.1亿人民币。2020年发布时间:2021-03-12
 2009年7月中国粉丝的购物行为特征情况该统计数据包含了2009年7月中国粉丝的购物行为特征情况。我会选在商场打折的时候购买占比最高,占比57.2%。2009年发布时间:2020-07-17
 2014年-2021年前11月字节跳动投资数量该统计数据包含了2014年-2021年前11月字节跳动投资数量。数据显示,2021年前11月字节跳动投资了68笔。2014-2021年发布时间:2021-12-03
 2020年6月中国购买新品、复购用户占直播间购物人群比例情况该统计数据包含了2020年6月中国购买新品、复购用户占直播间购物人群比例情况。购买新品占直播间购物人群比例最高,占比75.3%。2020年发布时间:2020-09-25
 2021Q2中国综合电商行业TOP10 APP的月均活跃设备数分布情况该统计数据包含了2021Q2中国综合电商行业TOP10 APP的月均活跃设备数分布情况。手机淘宝APP的月均活跃设备数最高,月均活跃设备数74599万台。2021年发布时间:2021-11-10
 2021年中国婚恋综艺《心动的信号4》节目声量平台分布情况该统计数据包含了2021年中国婚恋综艺《心动的信号4》节目声量平台分布情况。心动的信号4节目声量来自于微博平台的占比最高,占比86.5%。2021年发布时间:2021-10-27
 2009年7月中国粉丝对是否购买新品牌的态度情况该统计数据包含了2009年7月中国粉丝对是否购买新品牌的态度情况。如果性价比很高,就可能会占比最高,占比74.1%。2009年发布时间:2020-07-17
 1967-2019年垂直电商领域创企的地域分布情况统计该统计数据包含了1967-2019年垂直电商领域创企的地域分布情况统计。2019年北京垂直电商领域创企公司数量为1212家。1967-2019年发布时间:2019-06-25
 1967-2019年中国垂直电商领域创企的成立时间情况统计该统计数据包含了1967-2019年垂直电商领域创企的成立时间情况统计。2019年垂直电商领域创企共计7家。1967-2019年发布时间:2019-06-25
 2020年6月中国直播间无优惠,用户有无购买产品的意愿情况该统计数据包含了2020年6月中国直播间无优惠,用户有无购买产品的意愿情况。有意愿的占比最高,占比53.2%。2020年发布时间:2020-09-25

