

"美国人数"相关数据
更新时间:2022-04-20镝数聚为您整理了"美国人数"的相关数据,搜报告,找数据,就来镝数聚,镝数聚帮您洞察行业动态,了解行业趋势。

 2008-2010年美国分账片中国票房情况该统计数据包含了2008-2010年美国分账片中国票房情况。其中2010年美国分账片中国票房为36.8亿元。2008-2010年发布时间:2020-05-30
 2018年中国各地域奢侈品消费人数分布情况该统计数据包含了2018年中国各地域奢侈品消费人数分布情况。2018年中国各地域奢侈品消费人数分布中,华东地区奢侈品消费人数占比为30%。2018年发布时间:2020-06-10
 2018年中国人工智能企业技术的应用分布情况该统计数据包含了2018年中国人工智能企业技术的应用分布情况。视觉的应用占比最高,占比46%。2018年发布时间:2021-11-10
 2018年1月14日腾讯视频《烎·2018潮音发布夜》直播在线人数情况该统计数据包含了2018年1月14日腾讯视频《烎·2018潮音发布夜》直播在线人数情况。2018年1月14日腾讯视频《烎·2018潮音发布夜》22:15的直播在线人数为1057万人。2018年发布时间:2020-10-16
 2012年中国在线视频电视剧覆盖人数及环比增速情况该统计数据包含了2012年中国在线视频电视剧覆盖人数及环比增速情况。2012年12月中国在线视频电视剧覆盖人数及环比增速分别为3.3亿人、3%。2012年发布时间:2020-07-17
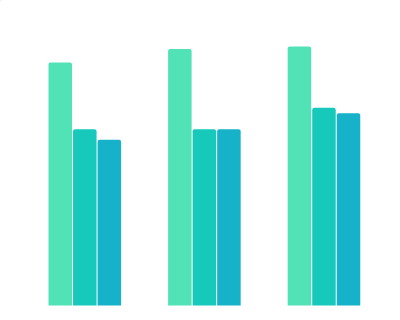 2017-2019年中国受访者中每天使用各电子产品人数占比该统计数据包含了2017-2019年中国受访者中每天使用各电子产品人数占比。2019年,受访者中每天使用智能手机的人数占97%。2017-2019年发布时间:2020-07-17
 2010年中、美、韩、日、法五国人均年观影次数对比情况该统计数据包含了2010年中、美、韩、日、法五国人均年观影次数对比情况。其中美国人均年观影次数为4.3次。2010年发布时间:2020-06-24
 2013-2019年中国人工智能领域在各行业的投资事件情况该统计数据包含了2013-2019年人工智能领域在各行业的投资事件情况。2019年人工智能领域在企业服务行业的投资事件最多,有15起。2013-2019年发布时间:2019-05-13
 2013-2019年中国人工智能领域在各地区的投资事件情况该统计数据包含了2013-2019年人工智能领域在各地区的投资事件情况。2019年人工智能领域在北京投资8起,广东6起,上海4起。2013-2019年发布时间:2019-05-13
 2013-2019年中国人工智能领域投资公司的轮次情况(按轮次维度)该统计数据包含了2013-2019年人工智能领域投资公司的轮次情况(按轮次维度)。其中A轮轮次的投资公司数量为74家,天使轮轮次的投资公司数量为69家,种子轮轮次的投资公司数量为50家.2013-2019年发布时间:2019-05-13
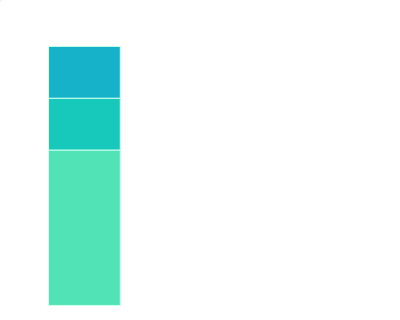 2013-2019年中国人工智能领域在各行业投资公司的轮次情况该统计数据包含了2013-2019年人工智能领域在各行业投资公司的轮次情况。其中企业服务行业中,天使轮轮次投资公司35家,A轮轮次投资公司29家,种子轮轮次投资公司16家。2013-2019年发布时间:2019-05-13
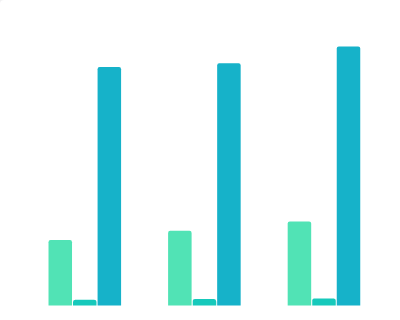 2010-2014年中美人均可支配收入与娱乐支出情况该统计数据包含了2010-2014年中美人均可支配收入与娱乐支出情况。2012年美国人均可支配收入最高,人均可支配收入12214美元。2010-2014年发布时间:2020-10-16
 2010-2014年中日韩美人均观影频次情况该统计数据包含了2010-2014年中日韩美人均观影频次情况。2013年韩国人均观影频次最高,人均观影频次4.3次。2010-2014年发布时间:2020-10-16
 2011年全球国家电影票房TOP10分布情况该统计数据包含了2011年全球国家电影票房TOP10分布情况。其中美国票房为91.73亿美金。2011年发布时间:2020-07-08
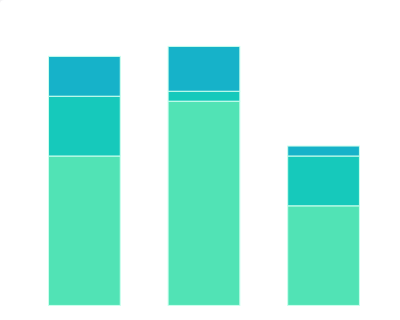 截至2022年2月17日部分中国风险投资机构海外投资重点区域分布该统计数据包含了截至2022年2月17日部分中国风险投资机构海外投资重点区域分布。IDG资本投资美国30家。2022年发布时间:2022-04-20
 2010-2014年中美城镇人均票房及占比情况该统计数据包含了2010-2014年中美城镇人均票房及占比情况。2010年美国城镇人均票房最高,人均票房34.2美元。2010-2014年发布时间:2020-10-16
 2020年中国新经济十大巨头海外投资的国家该统计数据包含了2020年中国新经济十大巨头海外投资的国家。2020年北美洲中美国海外投资的事件数为13件。2020年发布时间:2021-03-12
 截至2022年2月中国投资机构在中国以外市场投资事件数量该统计数据包含了截至2022年2月中国投资机构在中国以外市场投资事件数量。数据显示,美国、印度、新加坡是中国资本最青睐的海外投资目的地,分别在当地投资了1435起、310起和187起。2022年发布时间:2022-04-02

