


收藏
分享
纠错
4月,美国劳工统计局(theBureauofLaborStatistics,简称BLS)基于美国2017年的数据,发布了一份最新的美国消费者支出调查报告。根据BLS报告,2017年,美国家庭平均税后收入为63,606美元,在扣除各项支出总和60,060美元后,所能储蓄下来的钱仅可怜的3,546美元,占收入的5.57%。并且,不同家庭之间的支出差异较大。平均而言,年龄在25岁以下及65岁以上消费者处于“入不敷出”状态。尽管美国居民的平均税前收入水平相较上一年下降了1.5%,但美国消费者在2017年的平均支出较上一年却上涨了4.8%。
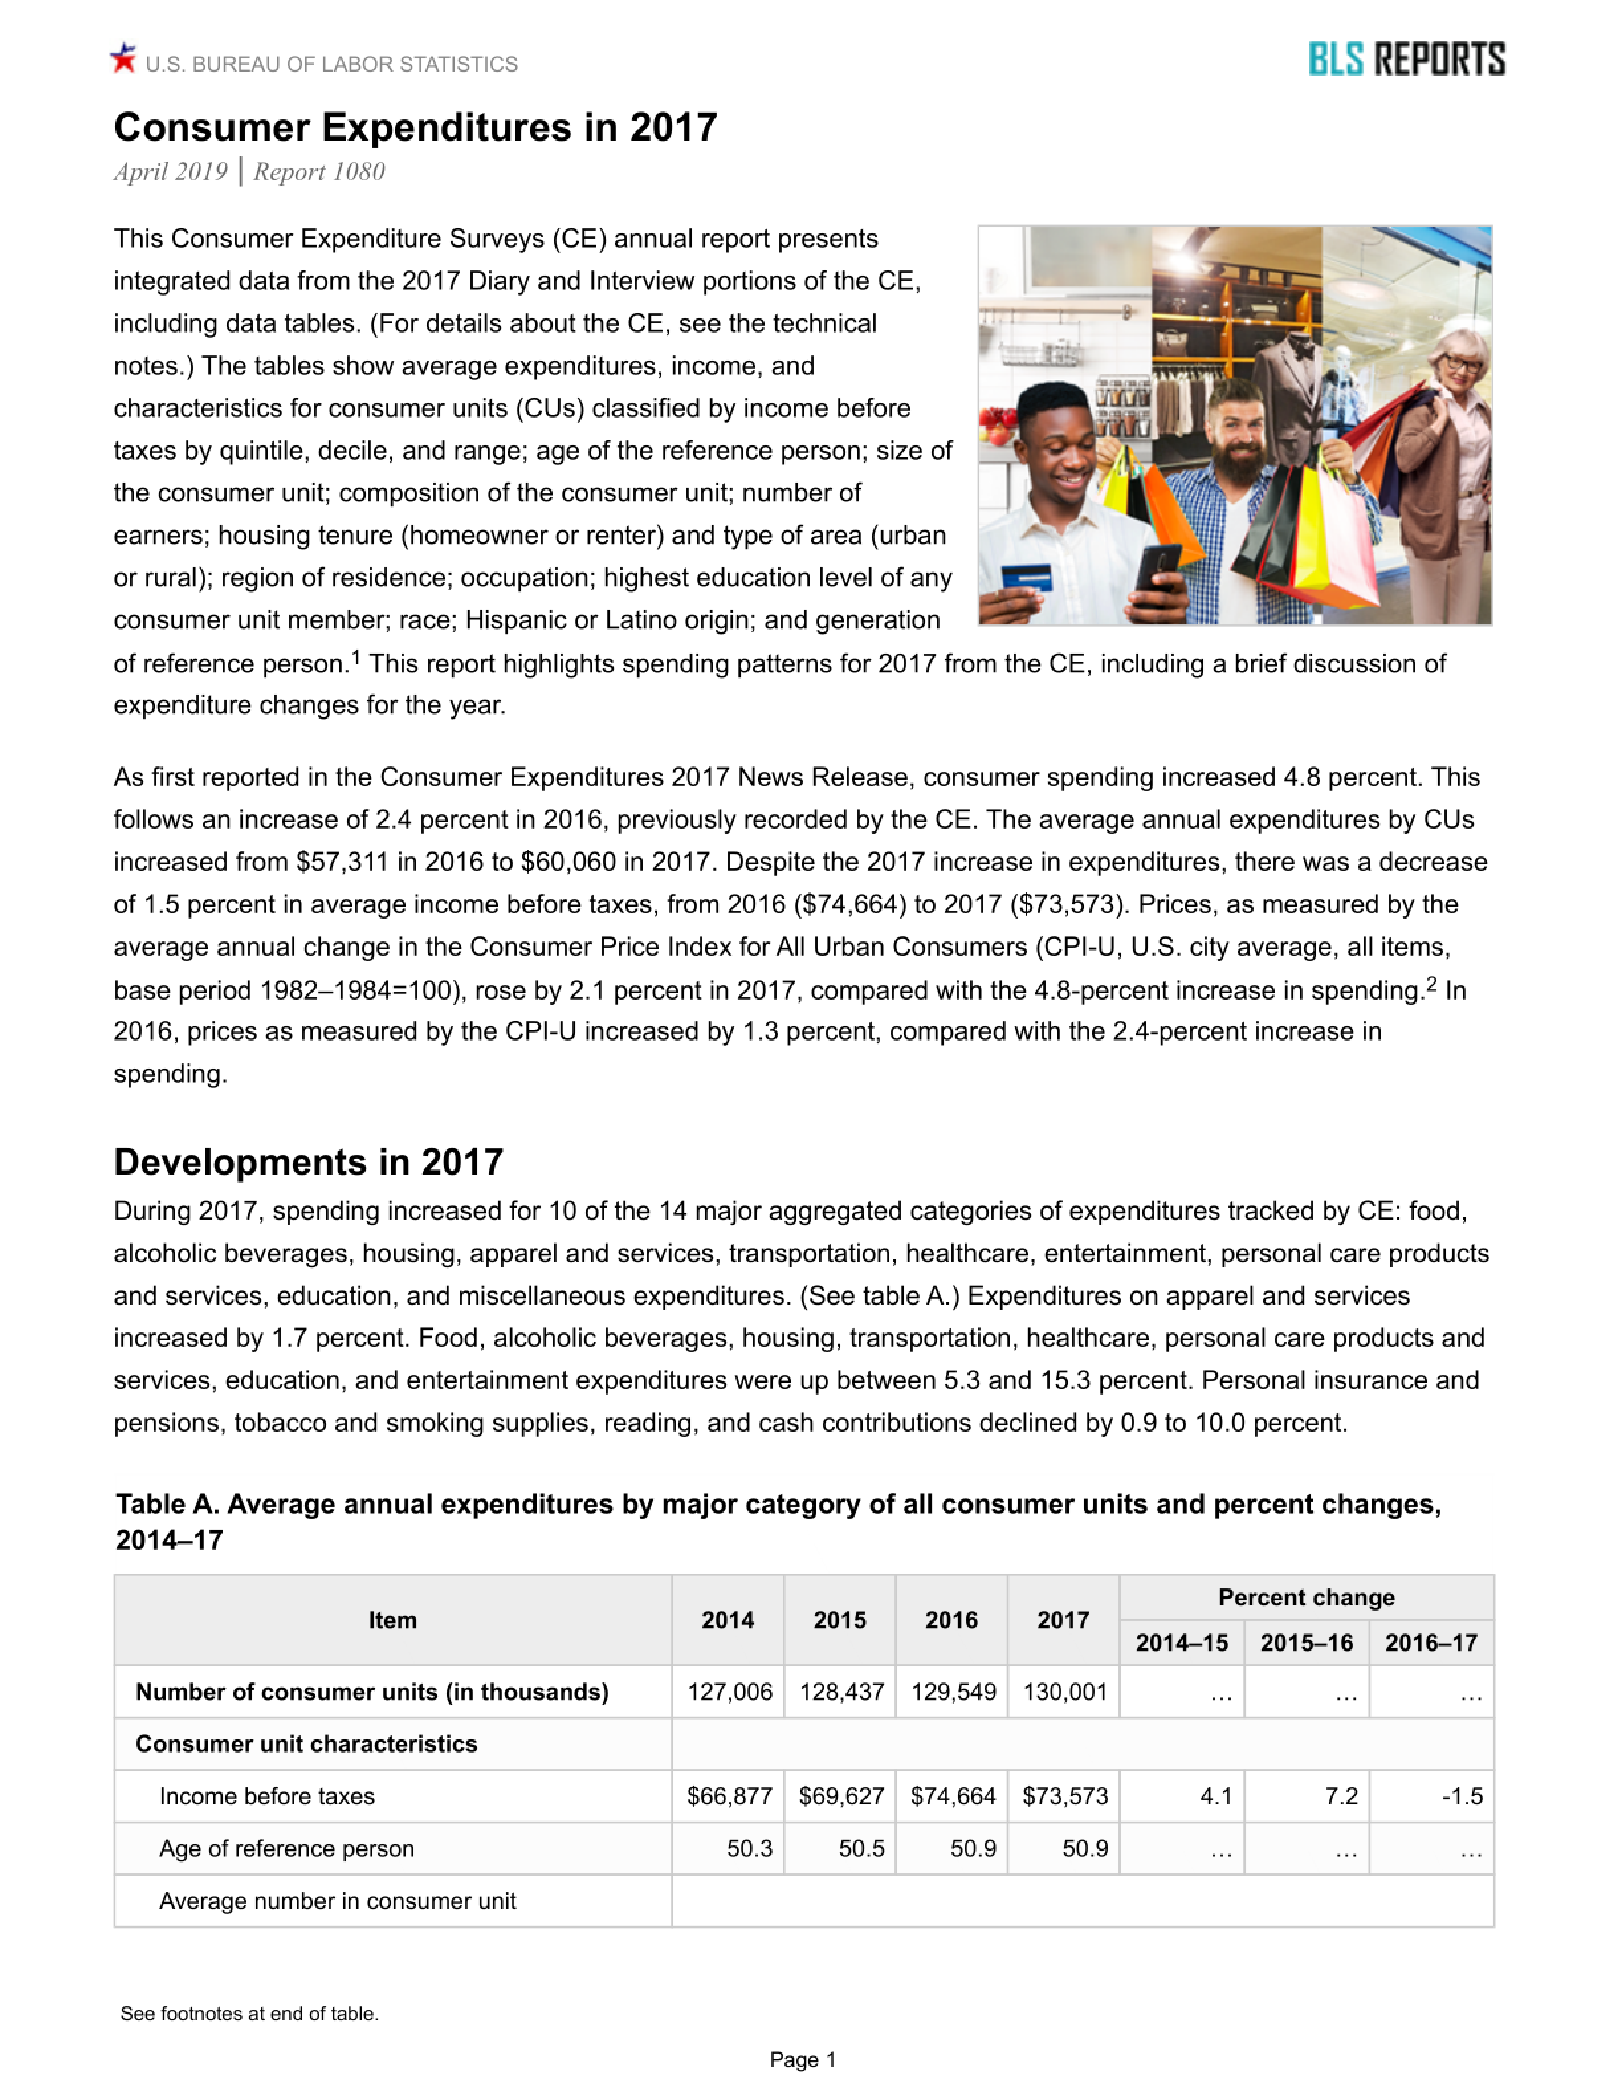
2017年美国消费者支出调查报告(英文)

This Consumer Expenditure Surveys (CE) annual report presents integrated data from the 2017 Diary and Interview portions of the CE,  including data tables. (For details about the CE, see the technical notes.) The tables show average expenditures, income, and characteristics for consumer units (CUs) classified by income before taxes by quintile, decile, and range; age of the reference person; size of the consumer unit; composition of the consumer unit; number of earners; housing tenure (homeowner or renter) and type of area (urban or rural); region of residence; occupation; highest education level of any consumer unit member; race; Hispanic or Latino origin; and generation hlill of reference person. 1 This report highlights spending patterns for 2017 from the CE, including a brief discussion of expenditure changes for the year.
As first reported in the Consumer Expenditures 2017 News Release, consumer spending increased 4.8 percent. This follows an increase of 2.4 percent in 2016, previously recorded by the CE. The average annual expenditures by CUs increased from $57,311 in 2016 to $60,060 in 2017. Despite the 2017 increase in expenditures, there was a decrease of 1.5 percent in average income before taxes, from 2016 ($74,664) to 2017 ($73,573).

【更多详情,请下载:2017年美国消费者支出调查报告(英文)】